เครื่องมือซอฟต์แวร์ฟรีสำหรับการวิเคราะห์ข้อมูลจากการทดลองเคมีบำบัดแบบกองซ้อนเวลา โดยอิงตามระบบประมวลผลภาพ ImageJ ของสถาบันสุขภาพแห่งชาติ (NIH)
- โซลูชันฟรีและเป็นอิสระจากแพลตฟอร์ม
- ให้กราฟและการทดสอบทางสถิติต่างๆ ที่ช่วยให้การวิเคราะห์ขั้นสูงของการทดลองเคมีบำบัด
การใช้งาน
- การวิเคราะห์ภาพและการตีความข้อมูลของการทดลองเคมีและการย้ายถิ่น
- การหาปริมาณของ 2D และ 3D chemotaxis assays
Applications
- Image analysis and data interpretation of chemotaxis and migration experiments
- Quantification of 2D and 3D chemotaxis assays
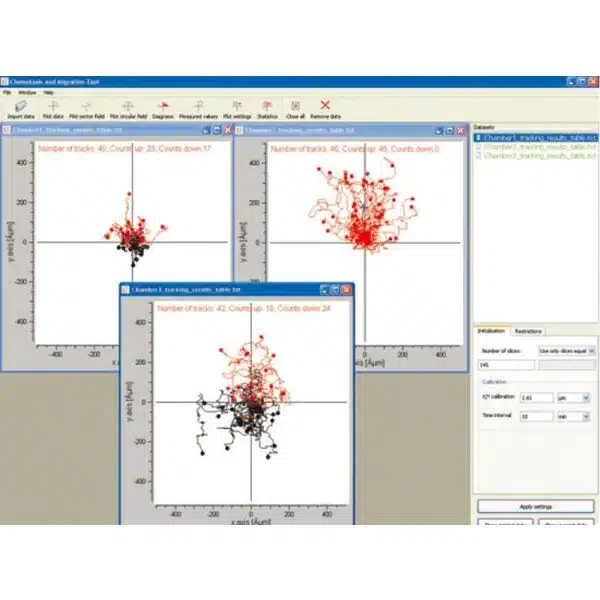
The Chemotaxis and Migration Tool is an ImageJ plug in. It is freely available and platform independent which means that the tool can be run on all major operating systems. The tool provides various graphs and statistical tests that allow advanced analysis of experimental data.
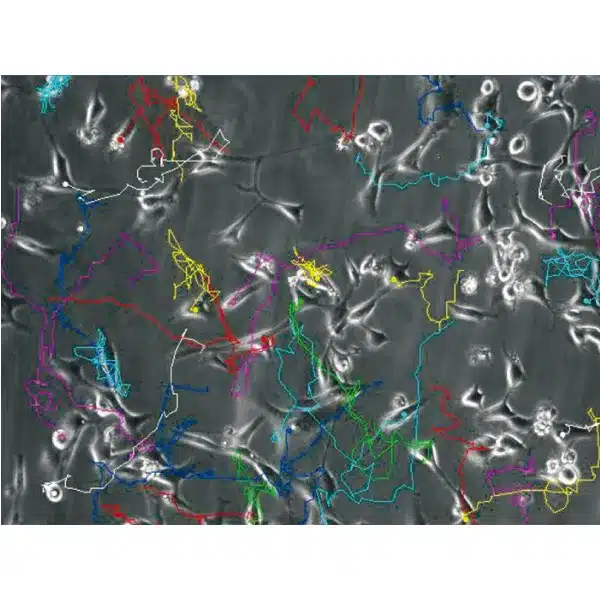
After cell tracking, the cells‘ paths can be plotted and analyzed for chemotactical effects. The simple to use microscopic calibration system provides access to a variety of parameters. For specific analyses, sector tools are available that count cells in angular or circular areas, known as Rose plots. A set of statistical tests complete the software package.
All calculations can be immediately visualized using the provided histograms and other diagrams. Optionally, all data can be exported for further analyses. With a complete set of migration data, the user is able to quantify chemotaxis and random migration.
The Chemotaxis and Migration Tool, together with the µ-Slide Chemotaxis enables users to analyze in minute detail the effect of drugs on the chemotactic behavior of cells.

Example Data
| CT-Exp. (+/-) | Contr. 1 (-/-) | Contr. 2 (+/+) | |
| Center of mass x [µm] | -4.0 | 3.6 | -7.6 |
| Center of mass y [µm] | 176.3 | 18.1 | -3.1 |
| Center of mass length [µm] | 176.4 | 18.5 | 8.2 |
| xFMI | -0.014 | 0.015 | -0.004 |
| yFMI | 0.280 | 0.035 | -0.007 |
| Directionality D | 0.33 | 0.16 | 0.21 |
| Mean Euclidean distance [µm] | 208.9 | 65.8 | 145.8 |
| Mean accumulated distance [µm] | 617.1 | 411.8 | 716.4 |
| Cell velocity [µm/min] | 0.43 | 0.29 | 0.49 |
| Rayleigh test | < 0.05 | >0.05 | >0.05 |

Downloads
The Chemotaxis and Migration Tool can be downloaded in the section “SoftwareDownload” (see tab above).
Download ImageJ here: http://rsb.info.nih.gov/ij/
For tracking cells in a time stack, ibidi recommends using the Manual Tracking plug in available from: http://rsb.info.nih.gov/ij/plugins/track/track.html
